OpenConfig with PAN-OS - Part 2 (XML API)

As of PAN-OS OpenConfig plugin version 2.1.1 and later, you are now able to pass XML API commands using OpenConfig. This comes in handy when requesting data that is not available directly via OpenConfig models (PAN-OS or common OpenConfig models). In this post we are looking into how to query the XML API data with OpenConfig using GNMIC and parse it with jq. Also we will look into how to use Telegraf with plugins to gather the data into InfluxDB.
Using GNMIC for OpenConfig queries and parsing with jq
Below you can see example of querying the data plane CPU usage. In this example I'm parsing the OpenConfig JSON output using jq. You could as well use any tool to parse the output.
# gnmic -a 10.0.0.1:9339 -u USER -p PASSWORD subscribe --encoding PROTO --timeout 30s --skip-verify --mode once --path "pan/xmlapi[cmd=show running resource-monitor]" | jq '.updates[].values."/pan/xmlapi".message | fromjson'

{
  "response": {
    "-status": "success",
    "result": {
      "resource-monitor": {
        "data-processors": {
          "dp0": {
            "second": {
              "task": {
                "send_out": "1%",
                "flow_lookup": "1%",
                "flow_slowpath": "1%",
                "dfa_result": "0%",
                "aho_result": "0%",
                "module_internal": "1%",
                "zip_result": "0%",
                "pktlog_forwarding": "2%",
                "flow_host": "1%",
                "fpga_result": "0%",
                "flow_fastpath": "1%",
                "flow_mgmt": "1%",
                "flow_ctrl": "2%",
                "send_host": "2%",
                "flow_forwarding": "1%",
                "nac_result": "0%",
                "flow_np": "1%"
              },
              "cpu-load-average": {
                "entry": [
                  {
                    "value": "0,0,0,0,0,0,0,0,0,0,0,0,0,0,0,0,0,0,0,0,0,0,0,0,0,0,0,0,0,0,0,0,0,0,0,0,0,0,0,0,0,0,0,0,0,0,0,0,0,0,0,0,0,0,0,0,0,0,0,0",
                    "coreid": "0"
                  }
                ]
              },
              "cpu-load-maximum": {
                "entry": [
                  {
                    "coreid": "0",
                    "value": "0,0,0,0,0,0,0,0,0,0,0,0,0,0,0,0,0,0,0,0,0,0,0,0,0,0,0,0,0,0,0,0,0,0,0,0,0,0,0,0,0,0,0,0,0,0,0,0,0,0,0,0,0,0,0,0,0,0,0,0"
                  },

... omitted for brevity...
Data Plane CPU usage via OpenConfig and XML API
It is also now possible to get, for example, Global Counter data directly from the firewall using OpenConfig.
# gnmic -a 10.0.0.1:9339 -u USER -p PASSWORD subscribe --encoding PROTO --timeout 30s --skip-verify --mode once --path "pan/xmlapi[cmd=show counter global]" | jq '.updates[].values."/pan/xmlapi".message | fromjson'

{
  "response": {
    "-status": "success",
    "result": {
      "dp": "dp0",
      "global": {
        "t": "19276",
        "counters": {
          "entry": [
            {
              "value": "798502465",
              "rate": "1354",
              "severity": "info",
              "category": "packet",
              "aspect": "pktproc",
              "desc": "Packets received",
              "id": "17",
              "name": "pkt_recv"
            },
            {
              "aspect": "pktproc",
              "desc": "Full Burst Packets received on retry",
              "id": "18",
              "name": "pkt_recv_retry",
              "value": "68128",
              "rate": "0",
              "severity": "info",
              "category": "packet"
            },

... omitted for brevity...
Global Counter metrics via OpenConfig and XML API
If you want to parse only Global Counters with severity of drop using jq:
# gnmic -a 10.0.0.1:9339 -u USER -p PASSWORD subscribe --encoding PROTO --timeout 30s --skip-verify --mode once --path "pan/xmlapi[cmd=show counter global]" | jq '.updates[].values."/pan/xmlapi".message | fromjson' | jq '.response.result.global.counters.entry[] | select( .severity == "drop" )'

{
  "value": "590076",
  "rate": "1",
  "severity": "drop",
  "category": "flow",
  "aspect": "parse",
  "desc": "Packets dropped: 802.1q tag not configured",
  "id": "671",
  "name": "flow_rcv_dot1q_tag_err"
}
{
  "desc": "Packets dropped: invalid interface",
  "id": "676",
  "name": "flow_no_interface",
  "value": "590076",
  "rate": "1",
  "severity": "drop",
  "category": "flow",
  "aspect": "parse"
}

... omitted for brevity...
Global Counter metrics via OpenConfig and XML API (filter only entries of severity "drop")
Global Counter metrics from OpenConfig to InfluxDB using Telegraf and Starlark processing
First we have to set up the gnmi input in Telegraf config to fetch the data from the firewall.
# GNMI input
[[inputs.gnmi]]
  addresses = ["10.0.0.1:9339"]
  username = "USER"
  password = "PASS"

  # Set encoding as "proto"
  encoding = "proto"

  # And as I'm using self-signed certificate, I'm enabling TLS but ignoring the certificate check.
  enable_tls = true
  insecure_skip_verify = true

  # I will set name_override for the input, which I will use to direct the output to Starlark processor
  name_override = "gnmi_globalcounters"

  # Define GNMI subscription (gather Global Counter data in 1m intervals)
  [[inputs.gnmi.subscription]]
    name = "gc_gnmi"
    path = 'pan/xmlapi[cmd=show counter global]'

    subscription_mode = "sample"
    sample_interval = "1m"
GNMI input in Telegraf
After setting up the gnmi input. We will set up the Starlark processor. This is required due to the (XML API) output being in format that cannot directly be processed to InfluxDB.
# Starlark processor
[[processors.starlark]]
  script = "/etc/telegraf/parse_gc_json.star"

  # Apply this processor only to gnmi_globalcounters
  namepass = ["gnmi_globalcounters"]
Starlark processor in Telegraf
We also need to set up the Starlark script (parse_gc_json.star). This will parse the data from the gnmi plugin output and output proper InfluxDB metrics.
# Load the necessary extensions (json for parsing the JSON data and time to create necessary timestamps)
load("json.star", "json")
load("time.star", "time")

def apply(metric):
    # We set one timestamp (now) to output all metrics with the same timestamp
    current_timestamp = time.now().unix_nano

    # Access the message field from the metric
    json_str = metric.fields.get("message", "")

    # Decode the message field to proper JSON
    parsed = json.decode(json_str)

    # Set up new array to save the processed data
    metrics = []

    # Set counters variable as the global counters entry array (we will loop through all the Global Counter entries)
    counters = parsed["response"]["result"]["global"]["counters"]["entry"]

    # Loop through the counter array
    for counter in counters:
        # Set up new metric name
        new_metric = Metric("globalcounters_oc_xmlapi")

        # Gather data that you want from the Global Counters. In this case I'm getting the counter value, name and severity. I will also set the metric timestamp as the current time (set as a variable in the beginning)
        new_metric.fields["value"] = int(counter["value"])
        new_metric.tags["name"] = counter["name"]
        new_metric.tags["severity"] = counter["severity"]
        new_metric.time = int(current_timestamp)

        # Append the new parsed metric into the new metrics array
        metrics.append(new_metric)

    # Return the new metrics array to Telegraf
    return metrics
Starlark script (parse_gc_json.star) for parsing the Global Counter data
Next we will set up InfluxDB output plugin to send the processed metrics to InfluxDB. You can also use temporary file to test and debug the output before sending it to the database.
# InfluxDB v2 output
[[outputs.influxdb_v2]]
  urls = ["http://influxdb:8086"]
  token = "TOKEN"
  organization = "ORG"
  bucket = "BUCKET"

  # If you have multiple inputs (like I do), filter this InfluxDB output to only contain the processed data by Starlark. Be sure to use the correct name (new metric name set in Starlark) to correctly match the namepass filter.
  namepass = ["globalcounters_oc_xmlapi"]
InfluxDB v2 output in Telegraf
Now when checking in the InfluxDB, you can see the properly parsed data.
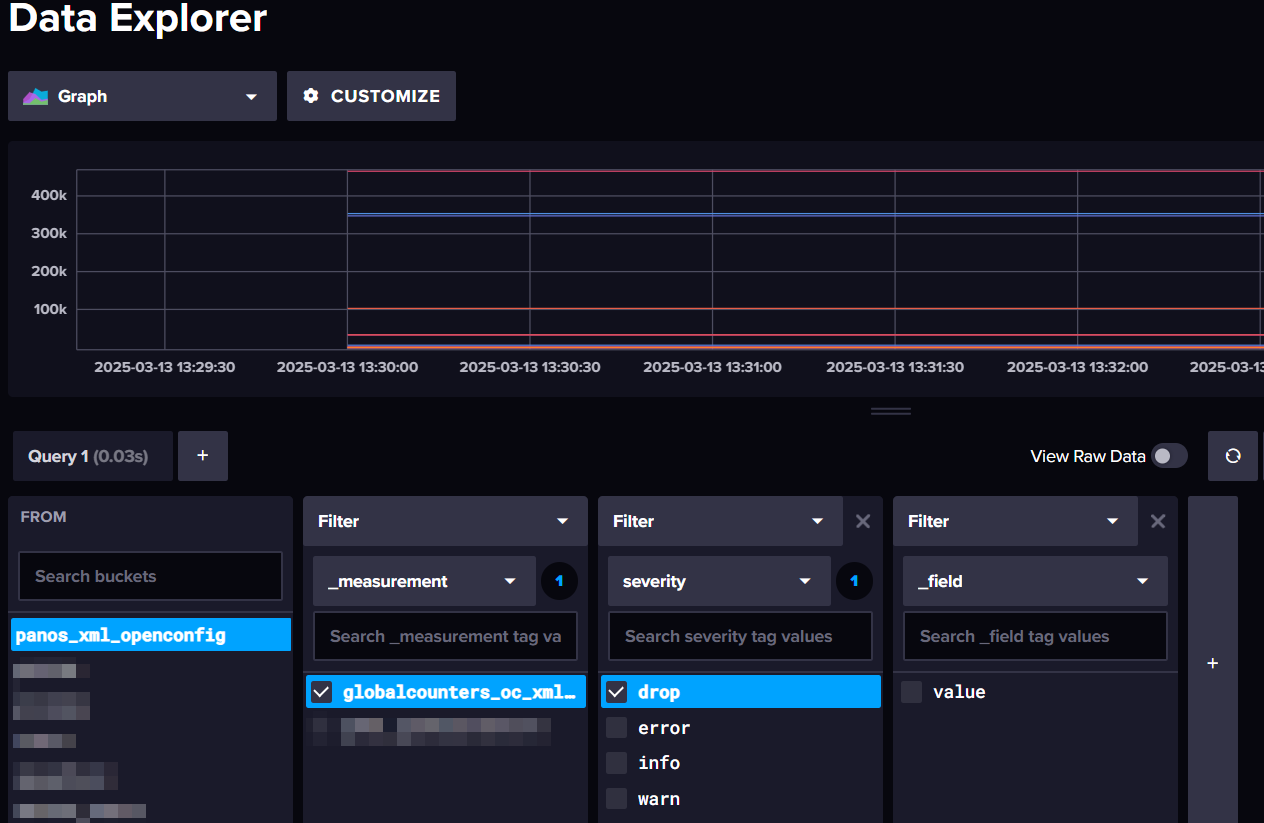
Next steps would be graphing the data in Grafana (for example). If needed, you can check my previous posts on how to do this.