Monitor and Visualize PiHole stats using Python, InfluxDB and Grafana

Visualizing PiHole stats allows you to view, graph and alert on various PiHole metrics.
In this example we are looking into how to run gather and visualize the PiHole data using a Python wrapper, InfluxDB 2.x and Grafana.
Prerequisites
I'm running all the software on Ubuntu 20.04 server and Python 3.10.2. Lesser versions should work also, though Python < 3 has not been tested (and should not be used anymore anyways).
- PiHole up-and-running
- InfluxDB 2.x installed (1.x will work also but the Python modules and syntax is different, so copy paste from this example does not work)
- Grafana installed
Test the PiHole API via browser or curl
Verify the API output(s) via browser or curl. You can modify the scripts based on the outputs to gather the data you want. I'm using "jq" piped below to pretty print the output JSON.
# Get the data for 10 minute sets over last 24 hours
cli@automate:~/pihole-stats# curl http://pihole/admin/api.php?overTimeData10mins
{
  "domains_over_time": {
    "1644771900": 435,
    "1644772500": 415,
    "1644773100": 185,
    [...]
  },
  "ads_over_time": {
    "1644771900": 46,
    "1644772500": 55,
    "1644773100": 9,
    [...]
  }
}

# Get the basic API data
cli@automate:~/pihole-stats# curl http://pihole/admin/api.php
{
  "domains_being_blocked": 102634,
  "dns_queries_today": 36719,
  "ads_blocked_today": 3961,
  "ads_percentage_today": 10.787331,
  "unique_domains": 8011,
  "queries_forwarded": 18496,
  "queries_cached": 14212,
  "clients_ever_seen": 30,
  "unique_clients": 26,
  "dns_queries_all_types": 36711,
  "reply_NODATA": 5470,
  "reply_NXDOMAIN": 1734,
  "reply_CNAME": 9184,
  "reply_IP": 20022,
  "privacy_level": 0,
  "status": "enabled",
  "gravity_last_updated": {
    "file_exists": true,
    "absolute": 1644719283,
    "relative": {
      "days": 1,
      "hours": 13,
      "minutes": 54
    }
  }
}
Get PiHole stats using Python
This Python script will fetch the PiHole API output, parse the JSON-formatted result and save it to remote InfluxDB 2.x server.
Note: You can of course modify the script to save the data anywhere you like or for example perform data calculations and such before saving the data.
#! /usr/bin/python
import requests
import time
from influxdb_client import InfluxDBClient, Point, WritePrecision
from influxdb_client.client.write_api import SYNCHRONOUS

# Send to InfluxDB function
def sendToInfluxdb(dns_last, block_last, HOSTNAME, INFLUXDB_SERVER, INFLUXDB_ORG, INFLUXDB_TOKEN, INFLUXDB_BUCKET):
    json_body = [
        {
        "measurement": "piholestats." + HOSTNAME,
        "tags": {
            "host": HOSTNAME
        },
        "fields": {
            "dns_queries": int(dns_last),
            "ads_blocked": int(block_last)
        }
        }
    ]
    client = InfluxDBClient(url=INFLUXDB_SERVER, token=INFLUXDB_TOKEN, org=INFLUXDB_ORG)
    write_api = client.write_api(write_options=SYNCHRONOUS)
    write_api.write(bucket=INFLUXDB_BUCKET, org=INFLUXDB_ORG, record=json_body)

def main():
  HOSTNAME = "pihole" # PiHole hostname to report in InfluxDB
  PIHOLE_API = "http://pihole/admin/api.php?overTimeData10mins" # PiHole API url
  INFLUXDB_SERVER = "http://influxdb:8086" # InfluxDB server
  INFLUXDB_ORG = "ORG" # InfluxDB Organization
  INFLUXDB_TOKEN = "TOKEN" # InfluxDB Token
  INFLUXDB_BUCKET = "pihole"  # InfluxDB Bucket

  # Get the API output
  api = requests.get(PIHOLE_API)
  API_out = api.json()

  # Save outputs from API query into variables
  domains_last10min = (API_out['domains_over_time'])
  blocked_last10min = (API_out['ads_over_time'])
  dns_last = domains_last10min[list(domains_last10min)[-2]]
  block_last = blocked_last10min[list(blocked_last10min)[-2]]

  # Call the send to InfluxDB function
  sendToInfluxdb(dns_last, block_last, HOSTNAME, INFLUXDB_SERVER, INFLUXDB_ORG, INFLUXDB_TOKEN, INFLUXDB_BUCKET)

if __name__ == "__main__":
  main()
Automate the Python script in Cron
The Python script above can be automated to run via Cron for example every 10 minutes (in the output below).
*/10 * * * * python3 /automate/pihole_stats/influxv2_piholestats.py >/dev/null 2>&1
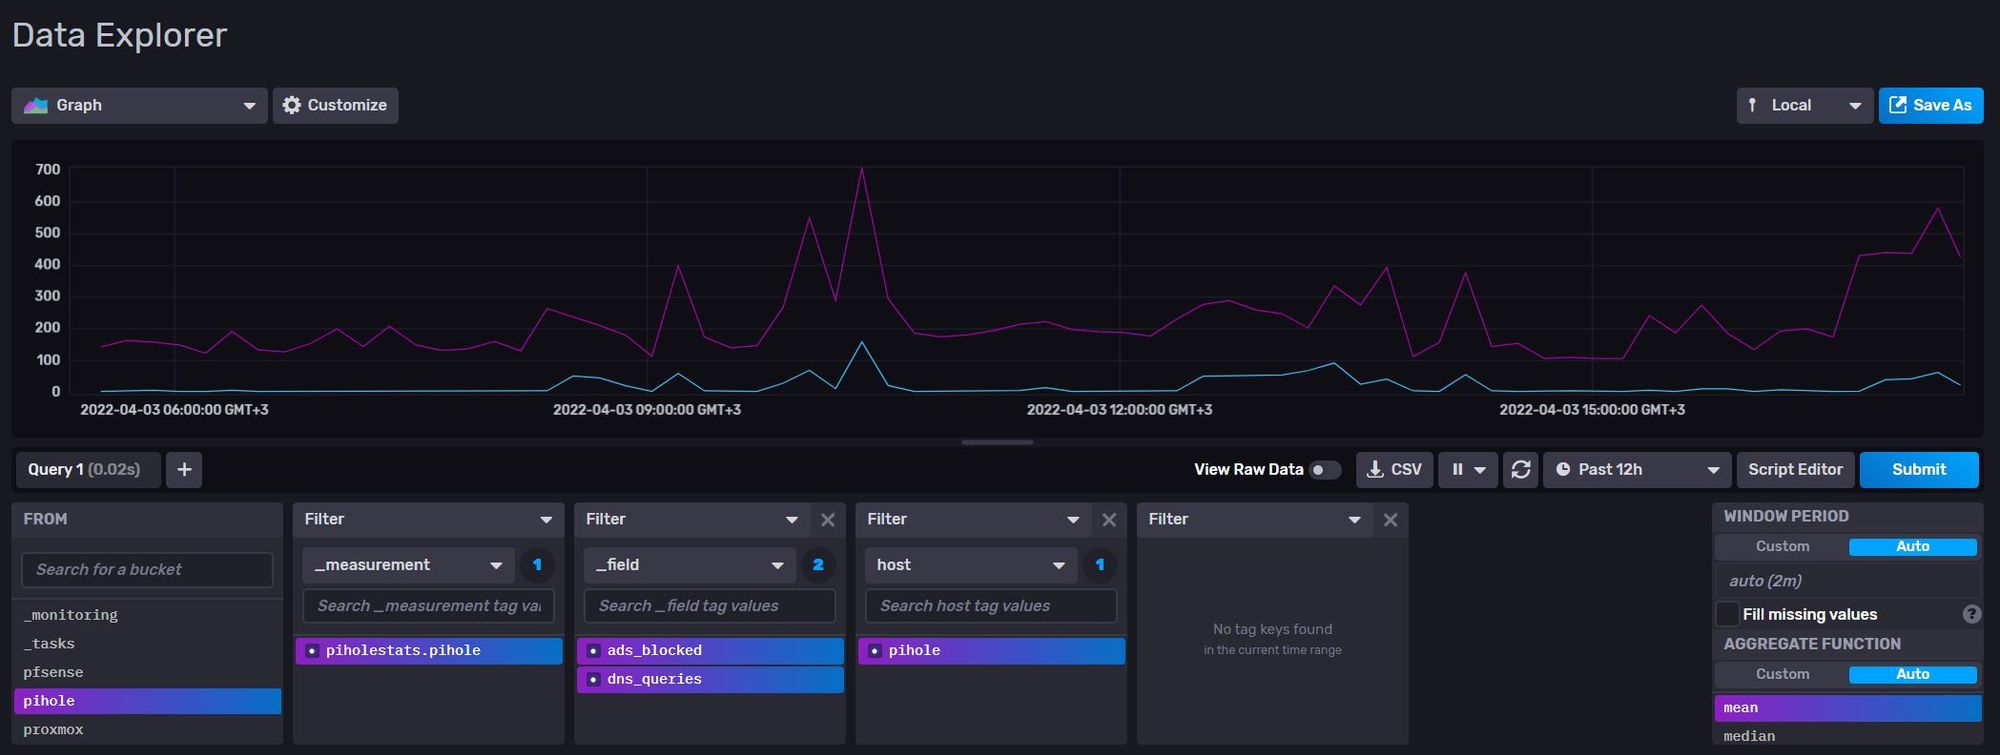
Verify data input in InfluxDB browser
Browse through the InfluxDB Data Explorer to verify that the data is coming to the proper Bucket and is getting written correctly.

Visualize data in Grafana
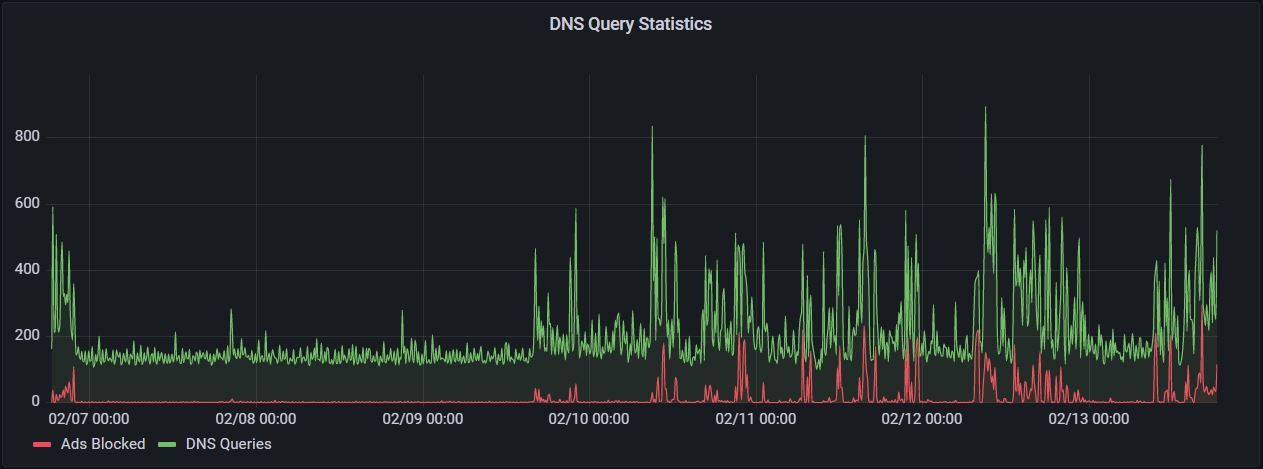
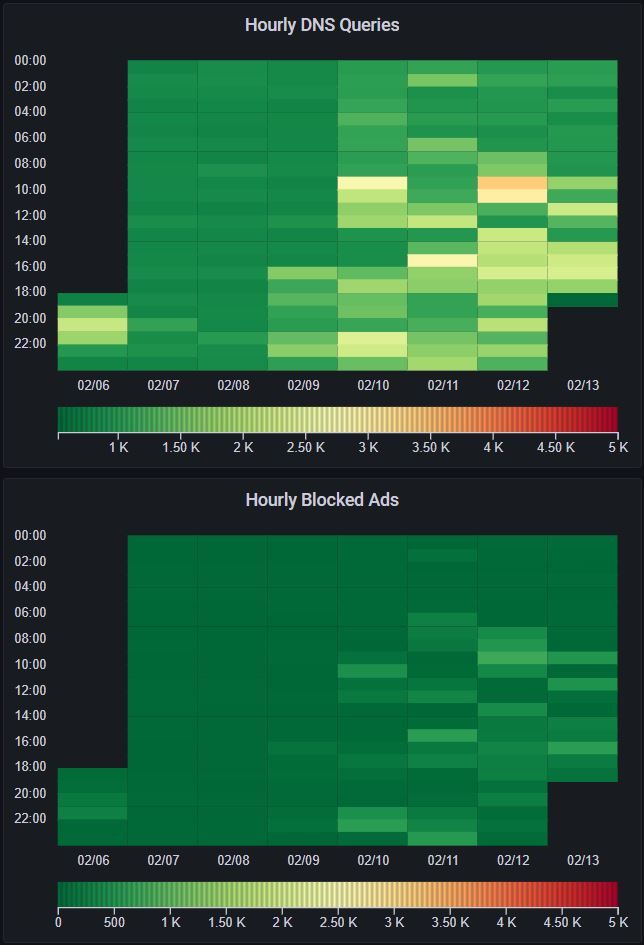
Below are three example graphs on how to visualize the data.

// PiHole - DNS Query statistics (Time series graph)
from(bucket: "pihole")
  |> range(start: v.timeRangeStart, stop: v.timeRangeStop)
  |> filter(fn: (r) => r["_measurement"] == "piholestats.pihole")
  |> filter(fn: (r) => r["_field"] == "ads_blocked" or r["_field"] == "dns_queries")
  |> yield(name: "last")

// PiHole - DNS Query statistics (Hourly heatmap)
from(bucket: "pihole")
  |> range(start: v.timeRangeStart, stop: v.timeRangeStop)
  |> filter(fn: (r) => r["_measurement"] == "piholestats.pihole")
  |> filter(fn: (r) => r["_field"] == "dns_queries")
  |> aggregateWindow(every: 10m, fn: last, createEmpty: false)
  |> yield(name: "last")
// PiHole - DNS Query statistics (Hourly blocked ads)
from(bucket: "pihole")
  |> range(start: v.timeRangeStart, stop: v.timeRangeStop)
  |> filter(fn: (r) => r["_measurement"] == "piholestats.pihole")
  |> filter(fn: (r) => r["_field"] == "ads_blocked")
  |> aggregateWindow(every: 10m, fn: last, createEmpty: false)
  |> yield(name: "last")
Conclusion
This short guide should allow you to visualize PiHole data outputs easily. You can modify the output and input as you see fit, and of course gather more detailed data via the API.