Visualize / Automate Speedtest runs using Python, InfluxDB and Grafana

Automating and visualizing Speedtest runs is a great way to measure your (homelab/home/work) Internet speed continuously. In addition to only creating pretty graphs of the measurements, you can create alarms, reports and even calculate percentiles from the data using InfluxDB functions.
In this example we are looking into how to gather and visualize the Speedtest data using the official Speedtest CLI app, Python wrapper, InfluxDB 2.x and Grafana. I will also provide some details on how to run the speedtest via Telegraf as an easy alternative to Python.
Prerequisites
I'm running all the software on Ubuntu 20.04 server and Python 3.10.2. Lesser versions should work also, though Python < 3 has not been tested (and should not be used anymore anyways).
- Install Speedtest CLI
- InfluxDB 2.x installed (1.x will work also but the Python modules and syntax is different, so copy paste from this example does not work)
- Grafana installed
- Telegraf installed if you want to use Telegraf instead of the Python wrapper
Get the nearest Speedtest servers
If you want to keep the results as comparable as they can be, you should always specify a server to use in the tests. This would force the Speedtest to always run against the same destination server. From your output, grab the ID you want to use.
# Get closest Speedtest server ID:s
cli@automate:~/speedtest-influxdb# speedtest -L
Closest servers:

    ID  Name                           Location             Country
==============================================================================
 22669  Elisa Oyj                      Helsinki             Finland
 31122  RETN                           Helsinki             Finland
 14928  Telia                          Helsinki             Finland
...
Run Speedtest via Python wrapper
This Python script will run the Speedtest CLI app, parse the JSON-formatted result and write it to a remote InfluxDB 2.x server.
Note: You can modify the script to save the data anywhere you like and/or for example perform data transfomrations and such before writing the data.
import datetime
import subprocess
import json
from influxdb_client import InfluxDBClient, Point, WritePrecision
from influxdb_client.client.write_api import SYNCHRONOUS

# Function to run speedtest process
def speedtest():
    try:
        # Run speedtest and return result dict
        process_out = subprocess.check_output(['/usr/bin/speedtest', '-f', 'json', '-s', '22669', '--accept-gdpr'])
    except subprocess.CalledProcessError as e:
        print("Error running Speedtest process\n", e.output)
        return None
    return(process_out)

def main():
    # InfluxDB parameters
    # InfluxDB server IP:port or hostname:port
    INFLUXDB_SERVER = "http://x.x.x.x:8086"
    # InfluxDB organization
    INFLUXDB_ORG = "ORG"
    # InfluxDB token
    INFLUXDB_TOKEN = "TOKEN"
    # InfluxDB bucket
    INFLUXDB_BUCKET = "speedtest"

    # Get current timestamp
    current_timestamp = datetime.datetime.utcnow()

    # Run speedtest function
    output = speedtest()

    if output != None:
        # Load output as JSON
        output_json = json.loads(output)

        # Verify that type is a speedtest result
        if(output_json['type'] == "result"):
            # Build proper JSON data format for InfluxDB
            json_body = [{
                "measurement": "bandwidth_data",
                "tags": {
                    "measurement_name": output_json['server']['name']
                },
                "time": current_timestamp.isoformat(),
                "fields": {
                    "Jitter": output_json['ping']['jitter'],
                    "Latency": output_json['ping']['latency'],
                    "Packet loss": float(output_json['packetLoss']),
                    "Download": output_json['download']['bandwidth'],
                    "Upload": output_json['upload']['bandwidth']
                }
            }]

            # Open connection to InfluxDB
            client = InfluxDBClient(url=INFLUXDB_SERVER, token=INFLUXDB_TOKEN, org=INFLUXDB_ORG)

            # Set the client to write in synchronous mode
            write_api = client.write_api(write_options=SYNCHRONOUS)

            # Write the data to InfluxDB database
            write_api.write(bucket=INFLUXDB_BUCKET, org=INFLUXDB_ORG, record=json_body)

            print("Speedtest output sent successfully!")
        else:
            print("Speedtest result parsing failed!")

if __name__ == "__main__":
    main()
Testing and running the script before automating via Cron
cli@automate:~/speedtest-influxdb# python3 speedtest-influxdb.py
Speedtest output sent successfully!
Automate the Python script in Cron
The Python script above can be automated to run via Cron for example every hour (in the output below).
Note: There might be some rate limit filters on the Speedtest servers so I wouldn't recommend running it every 30 seconds.
# Add to crontab to run every hour
0 * * * * python3 /speedtest-influxdb/speedtest-influxdb.py >>/var/log/speedtest.log 2>&1
Running the Speedtest CLI via Telegraf
You can also run the Speedtest CLI via Telegraf. This uses the Telegraf exec plugin so for this example to work you have to have Telegraf and Speedtest CLI installed on the same server. Also you must have proper outputs configured on Telegraf side to write the output (for example InfluxDB 2.x output).
Same Speedtest CLI command can be used as in the Python script. The "json_string_fields" are text fields that are also sent to the output destination database. In this case we are saving the destination server name, location and IP-address.
[[inputs.exec]]
commands = ["/usr/bin/speedtest -f json -s 22669 --accept-gdpr"]
name_override = "Speedtest"
timeout = "1m"
interval = "60m"
data_format = "json"
json_string_fields = [ "server_name",
                       "server_location",
                       "server_ip" ]
Verify data input in InfluxDB browser
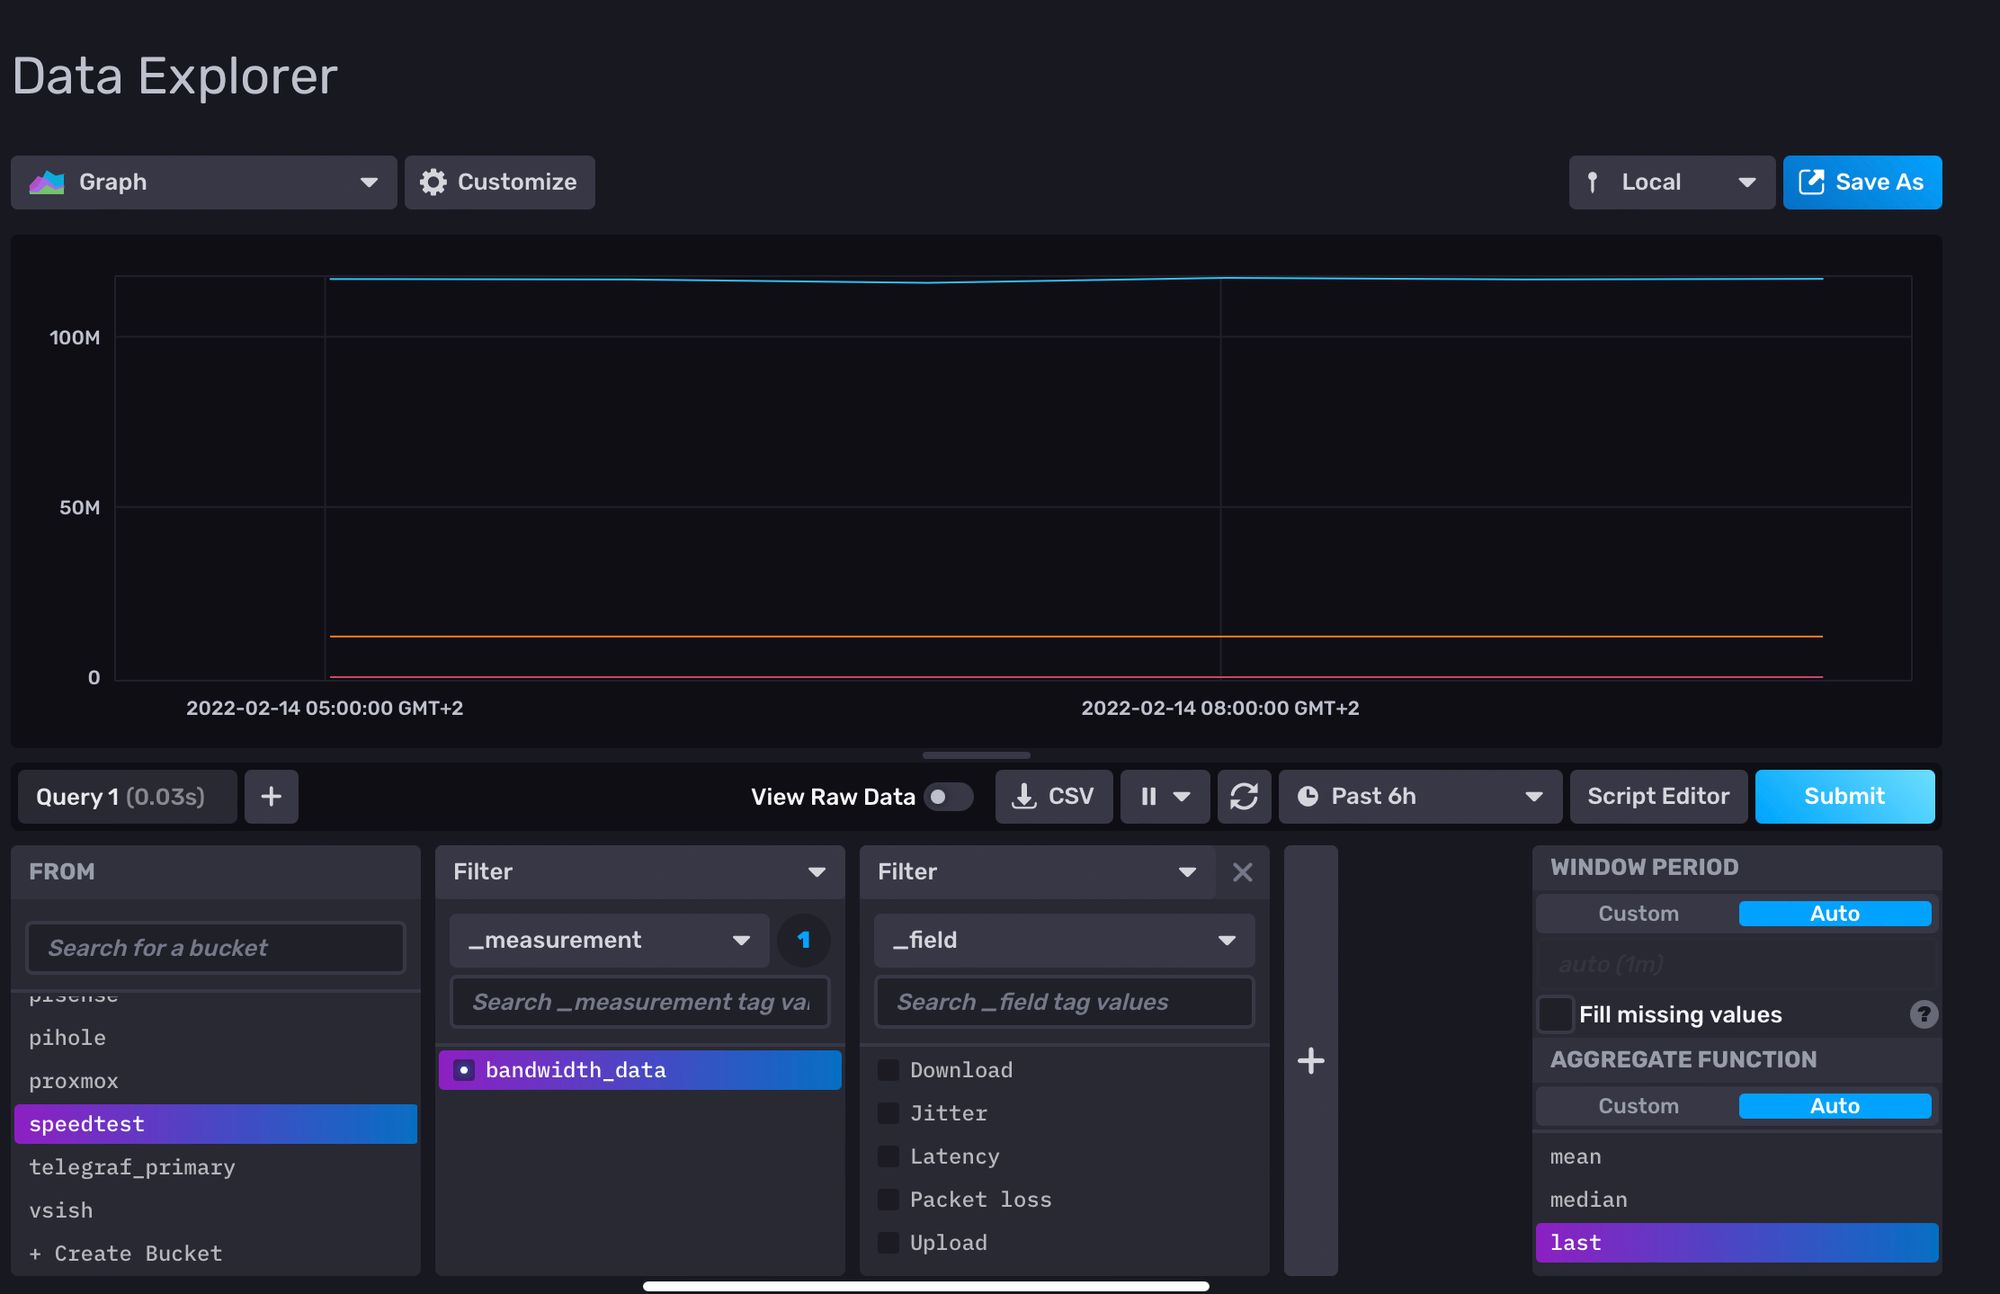
Browse through the InfluxDB Data Explorer to verify that the data is coming to the proper Bucket and is getting written correctly.

Visualize data in Grafana
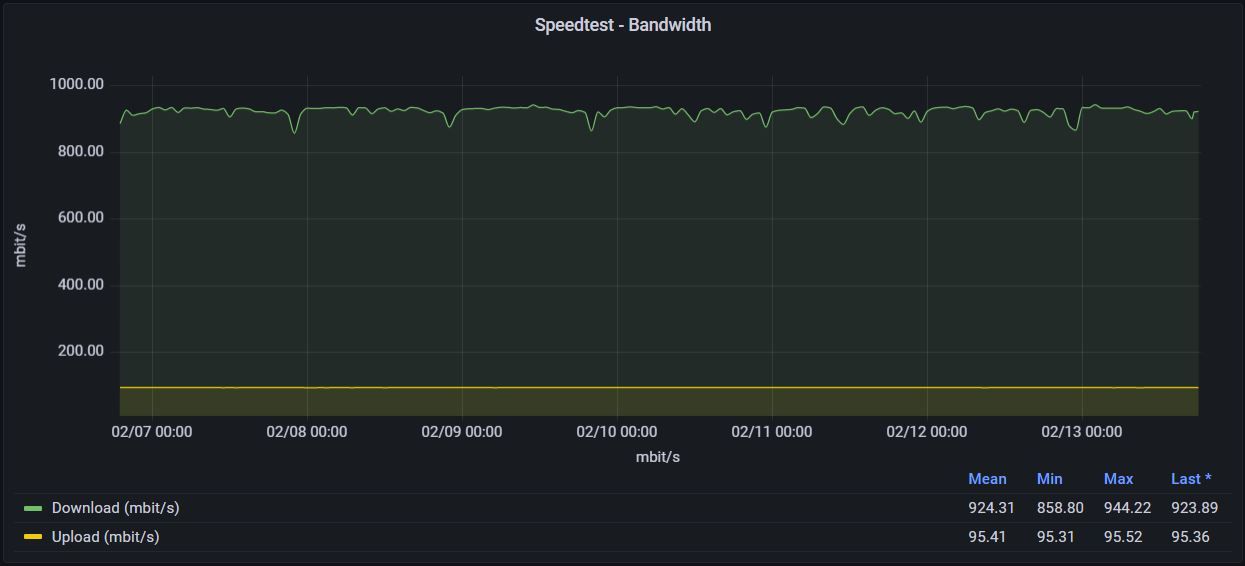
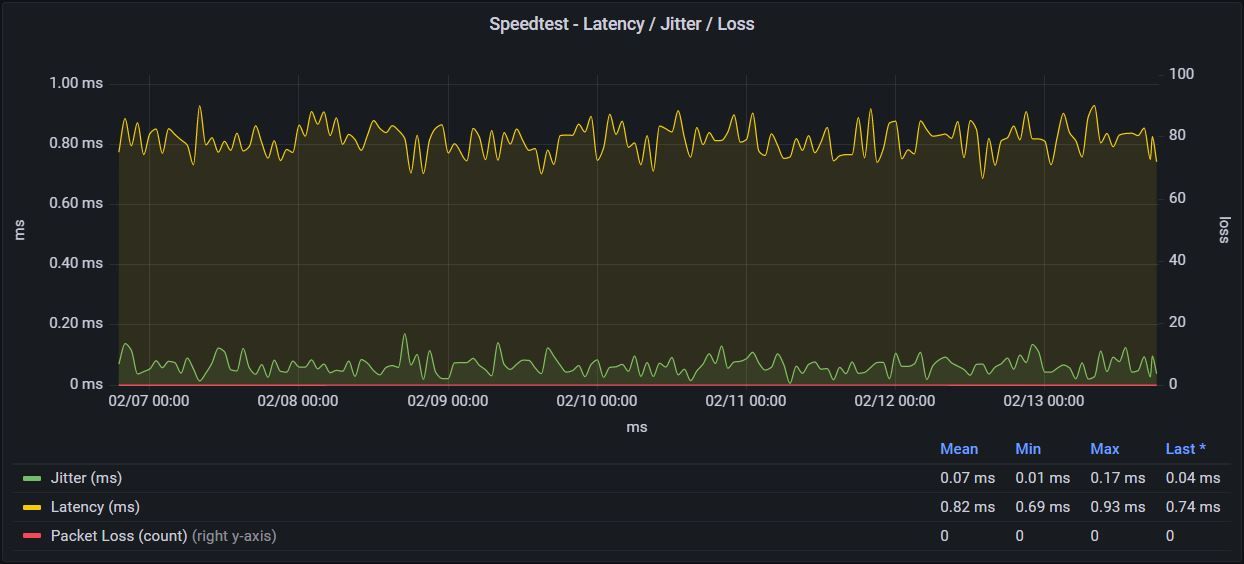
I created a quick dashboard which displays two graphs for the data visualization. The first graph contains view for download and upload bandwidths (as mbit/s, calculated in the InfluxDB query) and the second one has latency, jitter and packet loss outputs.

// Speedtest - Download / Upload Bandwidth
from(bucket: "speedtest")
  |> range(start: v.timeRangeStart, stop: v.timeRangeStop)
  |> filter(fn: (r) => r["_measurement"] == "bandwidth_data")
  |> filter(fn: (r) => r["_field"] == "Download" or r["_field"] == "Upload")
  |> map(fn: (r) => ({
     r with _value: float(v: r._value) / 1000.0 / 1000.0 * 8.0
   }))
  |> yield(name: "last")

// Speedtest - Latency / Jitter / Packet Loss
from(bucket: "speedtest")
  |> range(start: v.timeRangeStart, stop: v.timeRangeStop)
  |> filter(fn: (r) => r["_measurement"] == "bandwidth_data")
  |> filter(fn: (r) => r["_field"] == "Jitter" or r["_field"] == "Latency" or r["_field"] == "Packet loss")
  |> yield(name: "last")
Conclusion
This short guide should allow you to automate and visualize Speedtest output easily. You can modify the output and input as you see fit (for example you could run the tests towards different servers on different continents and monitor the bandwidth, latency and packet loss in more detail).
All the scripts above can be found in the GIT repository